cd ../projects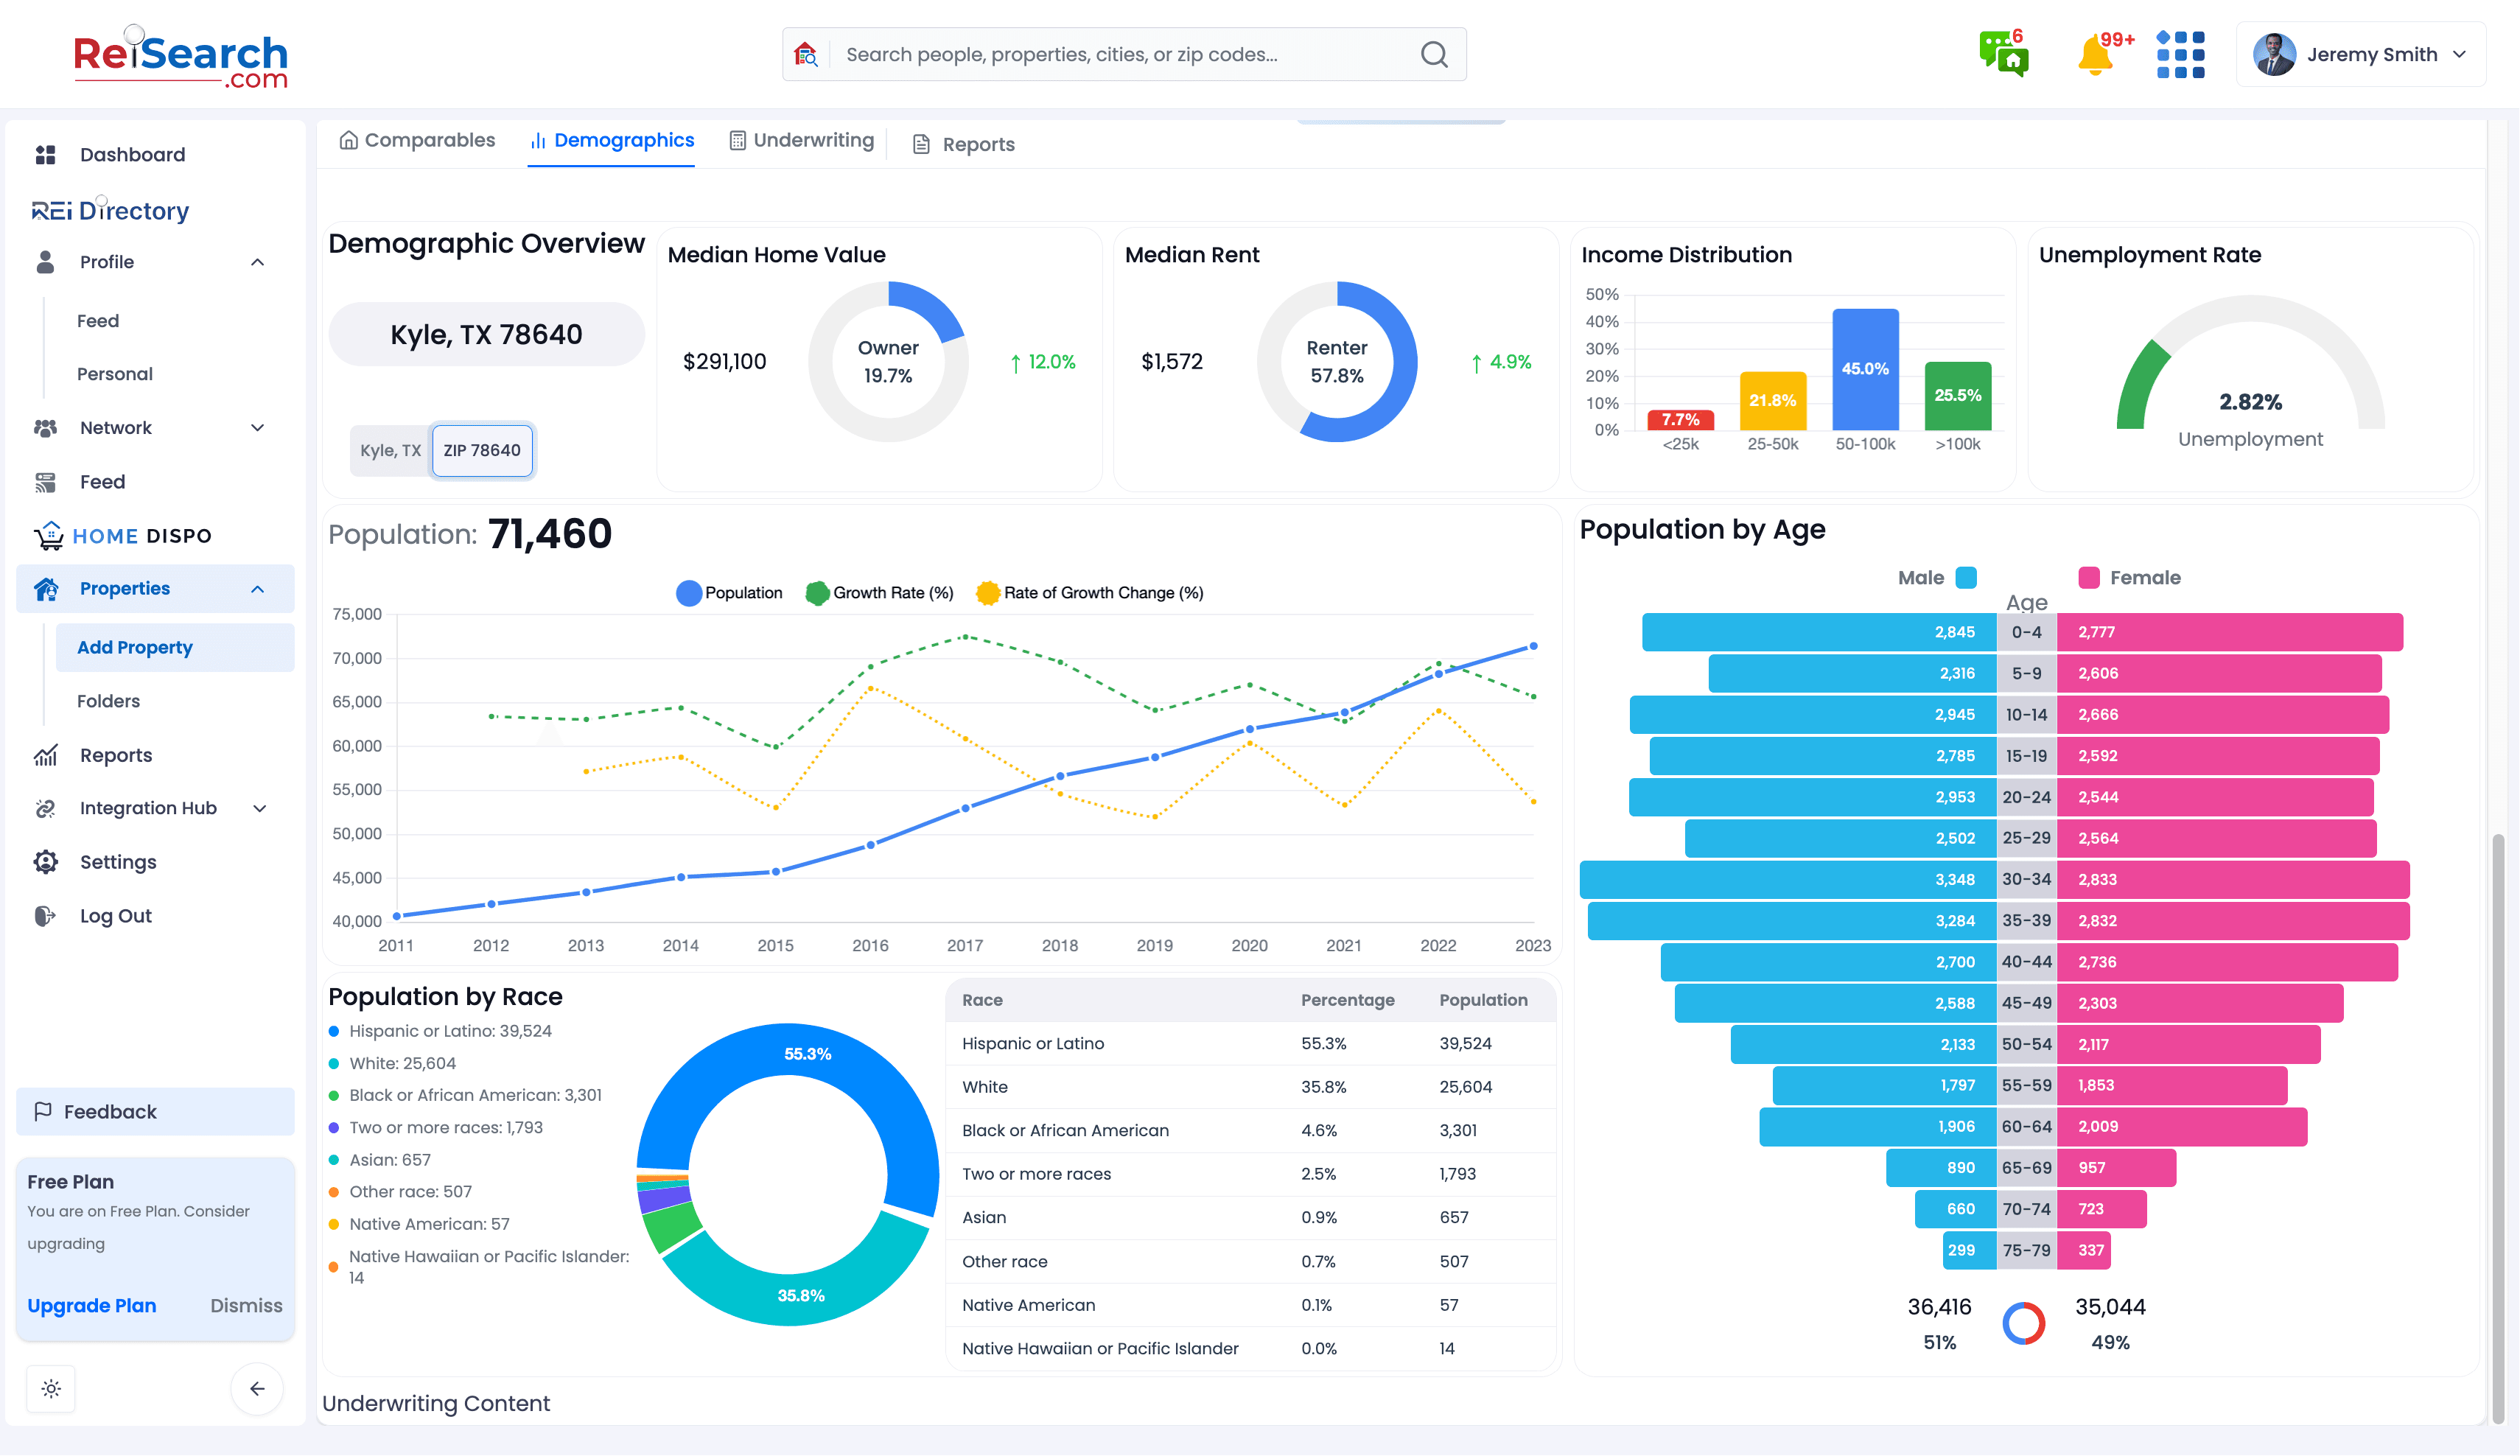
[ CASE_STUDY // 03 ]
Market Data Pipeline
A 9.6M-record housing data pipeline that turned raw government TSV files into a queryable analytics layer.
PandasNumPyDynamoDBAWS LambdaETLPython
9.6MRows
99.8%Accuracy
The Problem
Investors were making decisions without market context. Redfin publishes housing statistics as raw TSV files. Useful for a data engineer, useless for a real estate professional.
The Solution
A pipeline that ingests, normalizes, and partitions 9.6M housing records:
- Geographic hierarchy: ZIP, city, county, metro, state, national. Each level queryable independently.
- DynamoDB single-table design sized for the actual access patterns: "show me median list price for Phoenix metro over the last 12 months" returns in milliseconds.
- Chart-rendering Lambda that produces investor-ready visualizations on demand.
- 99.8% data accuracy across 10+ scraping and ingestion sources, validated against ground-truth samples.
Stack
- Python + Pandas / NumPy for ingestion, cleaning, and aggregation.
- AWS Lambda for the pipeline runner and the chart-rendering service.
- DynamoDB with thoughtful partition / sort key design and conditional writes.
- SQS for fan-out, idempotency, and retry semantics.
Outcome
Investors went from blind to informed. The same data that used to require a data team to interpret became a single click in the platform.